Turn CLV Analysis Into Daily Budgets for Practitioners
Turn CLV analysis into a daily budgeting tool: validate 24–36 months of transaction data, score confidence, and reallocate spend.

Turn CLV Analysis Into Daily Budgets for Practitioners
Customer lifetime value analysis is the practice of estimating how much profit a customer will generate over their relationship with your business, then using that number to decide who to acquire, how much to spend doing it, and where to invest in retention. The immediate payoff is a defensible acquisition ceiling: if your average customer’s margin-adjusted CLV is $300, you know exactly how much you can afford to spend winning that customer without losing money. Several formulas exist, from simple revenue math to predictive models, and picking the right one depends on your data maturity, not your ambition.
TL;DR:
- Companies with long customer lifespans and high margins should incorporate discount rates into their CLV models to avoid overestimating value for future profits.
- Use margin CLV rather than revenue CLV when setting acquisition budgets to accurately reflect profitable customer contributions and avoid overspending.
- Predictive CLV becomes reliable only after at least 24 months of high-quality, cross-platform data and sufficient sample sizes, making cohort analysis preferable for smaller data sets.
- Segmenting CLV by acquisition channel and customer persona reveals where to reallocate marketing budgets more effectively based on lifetime value and retention differences.
- Operationalizing CLV requires regular validation and confidence-scored recommendations to ensure that daily budget decisions are based on trustworthy, aggregated insights.
Table of Contents
- What Is Customer Lifetime Value, and Why Does It Change Marketing Decisions?
- How Do You Calculate Customer Lifetime Value?
- Historical, Cohort, and Predictive CLV: Which Model Fits Your Data?
- What Data Do You Need for Reliable CLV Analysis?
- How Do You Analyze CLV by Segment and Channel?
- How Do You Use CLV to Set Acquisition Budgets?
- What Actually Increases Customer Lifetime Value?
- How Do You Operationalize CLV Once You’ve Calculated It?
- How Do Discount Rates Affect Customer Lifetime Value?
- What Predictive Modeling Techniques Work Best for CLV?
- What Are the Biggest Challenges in CLV Analysis?
- How Do CLV Benchmarks Vary by Industry?
- What Tools Handle CLV Analysis Well?
- How Does CLV Inform Segmentation and Personalization?
- Adopting CLV Analysis Without Overcomplicating It
- Turning CLV Insights Into Daily Budget Decisions
- Sources
- FAQ
What Is Customer Lifetime Value, and Why Does It Change Marketing Decisions?
CLV and LTV are the same metric wearing different labels. Both estimate the total value a customer brings to your business, and both come in two flavors: revenue CLV, which counts gross sales, and margin CLV (sometimes called profit CLV), which subtracts cost of goods sold and delivery costs. The distinction matters more than most marketers admit. A subscription box business with 60% gross margin and a wholesale distributor running on 12% margin cannot use the same revenue-based CLV number to set acquisition budgets. One has far more room to spend on paid media than the other, even if their revenue CLV looks identical on a spreadsheet.
CLV shows up in four recurring business decisions:
- Setting how much you can spend to acquire a customer in a given channel or segment
- Forecasting revenue based on cohort behavior rather than guesswork
- Deciding where incremental retention dollars produce the biggest return
- Allocating budget across a portfolio of products, regions, or customer segments
The benchmark most practitioners reach for is the LTV:CAC ratio, with 3:1 cited as a common threshold for healthy unit economics. Treat that number as a starting point, not gospel. A capital-efficient SaaS company might target 5:1, while a fast-growing marketplace intentionally running near 1:1 for a season to buy market share isn’t necessarily doing anything wrong. Context around growth stage, payback tolerance, and cash position always outranks a rule of thumb
How Do You Calculate Customer Lifetime Value?
The simplest version of the CLV formula needs three inputs you almost certainly already track: average order value, purchase frequency, and average customer lifespan.
- Calculate average order value (total revenue ÷ number of orders)
- Calculate purchase frequency (number of orders ÷ number of unique customers, over a set period)
- Multiply AOV by frequency to get customer value per period
- Multiply that by average customer lifespan (in the same period unit) to get revenue CLV
Worked example: Say your average order value is $80, customers buy 4 times a year, and the average customer sticks around for 3 years. Customer value per year is $80 × 4 = $320. Revenue CLV is $320 × 3 = $960.
That number is useful, but it overstates what you can actually spend on acquisition, because it ignores cost of goods and fulfillment. If your gross margin runs at 45%, margin CLV is $960 × 0.45 = $432. That $432, not the $960 headline figure, is what should inform your acquisition ceiling.
The math that actually protects your budget: At a healthy LTV:CAC target, a $432 margin CLV supports a maximum CAC roughly one third of that. Spend more than that per customer in this segment and you’re buying growth at a loss.
Predictive and discounted variants adjust this further by applying churn probability models and a time-value-of-money discount, covered later in this guide. Start with the simple formula. Move to predictive modeling only once your data can support it.
Historical, Cohort, and Predictive CLV: Which Model Fits Your Data?
Three approaches dominate CLV work, and they map fairly cleanly to how much historical data and infrastructure you have.
- Historical CLV looks backward at what customers have already spent. It’s fast, requires no modeling expertise, and works fine for retrospective reporting, but it says nothing about customers who haven’t finished their lifecycle yet.
- Cohort-based CLV groups customers by acquisition date or channel and tracks how their value accumulates over time. This is the workhorse for most mid-market teams because it reveals trends (is the March cohort outperforming January?) without requiring machine learning.
- Predictive CLV uses statistical or machine learning models to forecast future value from early behavioral signals, letting you estimate a new customer’s worth within their first 30 to 90 days.
Before jumping to predictive modeling, run through a short checklist: Do you have at least 24 months of clean transaction history? Is your sample size large enough per segment to avoid noisy estimates? Do you have the infrastructure to retrain and validate models on a recurring basis? If the answer to any of these is no, cohort analysis will serve you better and cost far less to maintain than a predictive model nobody trusts.
What Data Do You Need for Reliable CLV Analysis?
Garbage in, garbage out applies harder to CLV than almost any other marketing metric, because a single bad assumption compounds across every downstream budget decision. The essential fields are transaction-level records tied to a unique customer ID, timestamps for every purchase, channel or campaign tags, gross margin or cost of goods sold, and returns or refund data.
Most teams underestimate how much history they need. A minimum of 24 to 36 months of transaction data is recommended before running cohort or predictive CLV, because shorter windows miss seasonal cycles and make lifespan estimates unreliable, particularly in categories with long repurchase gaps like furniture or electronics.
Watch for these common data problems before you trust any CLV output:
- Duplicate customer IDs from guest checkout or multiple email addresses
- Mixed currencies in a global dataset that were never normalized
- Inconsistent event tracking between web, app, and in-store channels
- Refunds and chargebacks that were never subtracted from revenue totals
Pro Tip: Run a simple duplicate-ID audit before anything else. Merging fragmented customer records almost always changes your average lifespan number more than any modeling technique you’ll apply afterward.
None of this works without a single source of truth. If your ad platforms, CRM, and analytics tools each report a different version of “revenue,” predictive CLV will amplify that disagreement into a genuinely noisy, unreliable signal, a warning Shopify’s own CLV guidance makes explicit.
How Do You Analyze CLV by Segment and Channel?
Raw CLV is a single number. Analysis starts when you break it apart by acquisition channel, product line, cohort, and customer persona, because averages hide the decisions that actually matter.
RFM scoring (recency, frequency, monetary value) and Customer Value Assessment frameworks give you a structured way to rank segments by how much incremental spend they deserve, rather than treating every customer as equally worth chasing. A CVA-style composite score reconciles the financial view (margin, payback) with the strategic view (loyalty, referral behavior) so budget decisions don’t default to whichever number is easiest to pull.
Comparing cohort LTV against CAC by channel is where the real reallocation decisions happen:
- Pull cohort LTV for each acquisition channel over the same time window
- Divide by that channel’s blended CAC to get a comparable LTV:CAC ratio
- Rank channels by ratio, not by raw volume or lowest CAC alone
- Reallocate incremental budget toward the channel with the best ratio, not necessarily the cheapest one
A pattern shows up constantly in this kind of analysis: paid social often drives high volume at a low CAC but a mediocre 90-day retention curve, while email-nurtured or referral customers convert less often but stick around two or three times longer. Judged purely on CAC, paid social wins. Judged on cohort LTV, referral traffic frequently wins by a wide margin. That is the entire argument for segment-level CLV over headline averages: HBR’s research on customer retention makes the case that keeping the right customers matters more than keeping more of them.
How Do You Use CLV to Set Acquisition Budgets?
CLV only earns its keep once it changes what you spend and where. The LTV:CAC ratio is the bridge between the two.
- Divide margin-adjusted CLV by blended CAC to get your ratio (aim for roughly 3:1 as a starting benchmark, adjusted for your growth stage and cash position)
- Calculate CAC payback period by dividing CAC by monthly gross margin per customer, which tells you how many months before an acquired customer turns profitable
- Set a channel-level acquisition ceiling using cohort LTV, not blended company-wide LTV, since channels vary widely in retention quality
- Present budget changes to finance using payback period alongside LTV:CAC, since finance teams weigh cash timing as heavily as the eventual return
Why payback timing changes everything: two channels can share an identical 3:1 LTV:CAC ratio and still deserve very different budget treatment. A channel with a 3-month payback frees up cash for reinvestment almost immediately. A channel with an 18-month payback ties up capital for a year and a half before it turns profitable, which matters enormously if you’re funding growth out of operating cash rather than a war chest. ConversionStudio’s benchmarking work flags payback period as the detail most CAC conversations skip.
What Actually Increases Customer Lifetime Value?
Every CLV improvement traces back to one of three levers: average order value, purchase frequency, or customer lifespan. They are not equally easy to move.
- AOV responds fastest to bundling, upsell flows at checkout, and free-shipping thresholds. Expect quick wins but a low ceiling.
- Purchase frequency improves through segmented retention campaigns, replenishment reminders, and subscription conversion. Slower to move, but the gains compound.
- Customer lifespan is the hardest lever and the most valuable one. Improving onboarding, fixing early-churn friction points, and building loyalty programs extend how long a customer stays active at all.
Retention deserves outsized attention here because the math is asymmetric. Wharton’s research on revenue analytics points to how a modest lift in retention rate can produce a disproportionate increase in profit, since retained customers cost nothing new to acquire and their margin drops straight to the bottom line.
Test these levers with holdout groups rather than trusting before-and-after comparisons. Run an incrementality test where one segment gets the new onboarding flow or loyalty offer and a matched control group doesn’t, then measure the CLV delta between groups over 90 to 180 days.
Pro Tip: A 5% improvement in retention rarely shows up as a dramatic single-quarter revenue jump. It shows up as compounding margin over 12 to 18 months, which is exactly why finance teams undervalue retention investment relative to acquisition spend.
How Do You Operationalize CLV Once You’ve Calculated It?
Calculating CLV once a quarter in a spreadsheet is a start. Turning it into a daily operating input is a different problem entirely, and it’s the one that trips up most teams once ad platforms, CRM systems, and analytics tools each report slightly different numbers.
The workflow that holds up in practice runs three steps: validate the underlying ad and CRM data across platforms, compute cohort CLV on that validated base, then prioritize incremental spend according to predicted impact and confidence rather than gut feel or whichever channel manager argues loudest in the budget meeting.
- Cross-platform validation catches mismatched attribution windows and duplicate conversions before they poison a cohort calculation
- Confidence-scored recommendations tell you which suggested budget shift is backed by strong evidence and which is a low-confidence guess worth testing small first
- Ranking suggestions by expected impact keeps teams focused on the two or three changes that move the number, instead of a scattershot list of minor tweaks
Noisy, fragmented data is the single biggest reason predictive CLV models produce recommendations nobody trusts enough to act on. Validating cross-platform data before modeling isn’t a nice-to-have step, it’s the difference between a model people use and one they quietly ignore.
Getpaidlens was built around exactly this sequence, connecting ad platforms and CRM data, validating it, and surfacing ranked recommendations with a confidence score attached, so a performance marketing team can act on a CLV-informed suggestion the same day it surfaces.
How Do Discount Rates Affect Customer Lifetime Value?
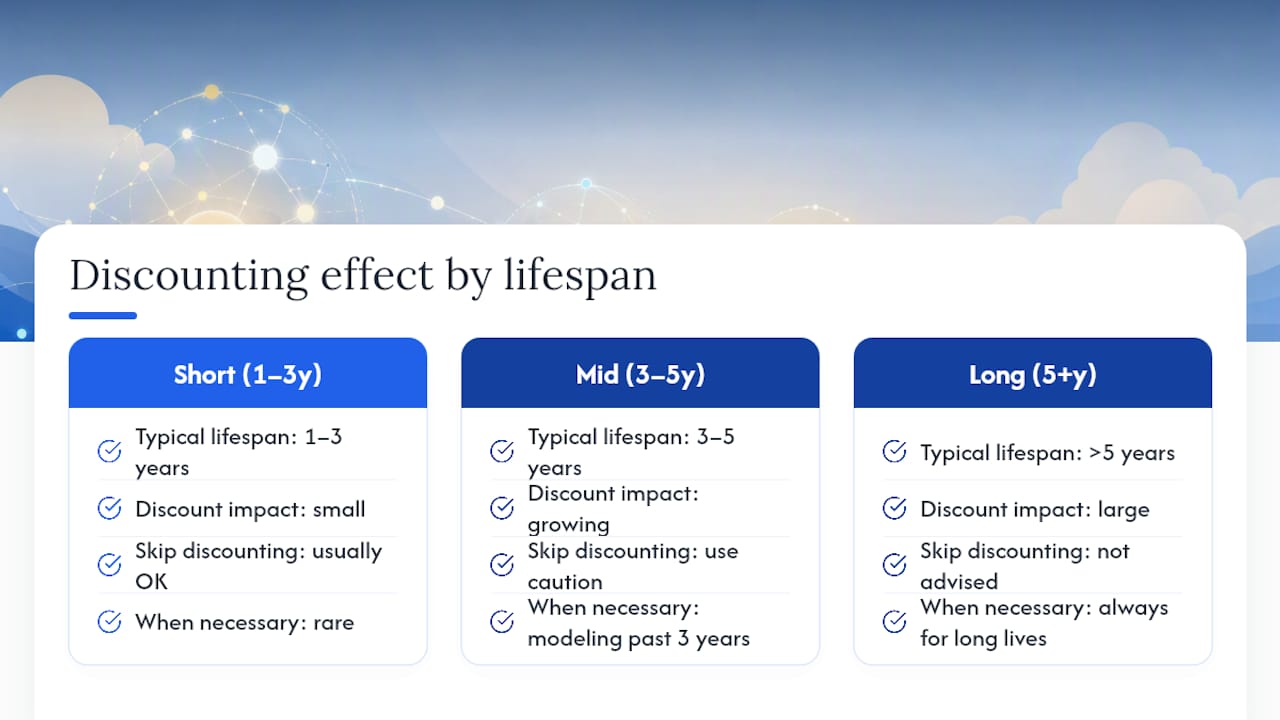
A dollar of profit three years from now is worth less than a dollar today, and any CLV model that ignores this systematically overstates long-lifespan customers. Discounted CLV applies a discount rate, often your company’s cost of capital or a standard rate like 10%, to future cash flows before summing them.
The mechanics are straightforward: instead of adding up projected profit for years 1, 2, and 3 at face value, you divide each year’s projected profit by (1 + discount rate) raised to that year’s power, then sum the results.
This adjustment matters most in two situations. First, high-margin businesses with long customer lifespans (think enterprise software or insurance) see meaningfully different CLV numbers depending on whether they discount at all, since the gap between undiscounted and discounted value grows every additional year you project forward. Second, businesses comparing customer segments with very different lifespan profiles need discounting to make an apples-to-apples comparison. A segment with a short, high-frequency lifecycle and a segment with a long, low-frequency one can show similar undiscounted CLV while having very different present-value economics once time is priced in.
Most small and mid-market businesses running simple or cohort-based CLV can skip discounting without much distortion, since typical customer lifespans of 1 to 3 years don’t compound the effect much. Once you’re modeling lifespans past 3 to 5 years, or comparing segments with meaningfully different retention curves, skipping the discount rate starts to bias your acquisition ceiling upward in ways that catch up with you.
What Predictive Modeling Techniques Work Best for CLV?
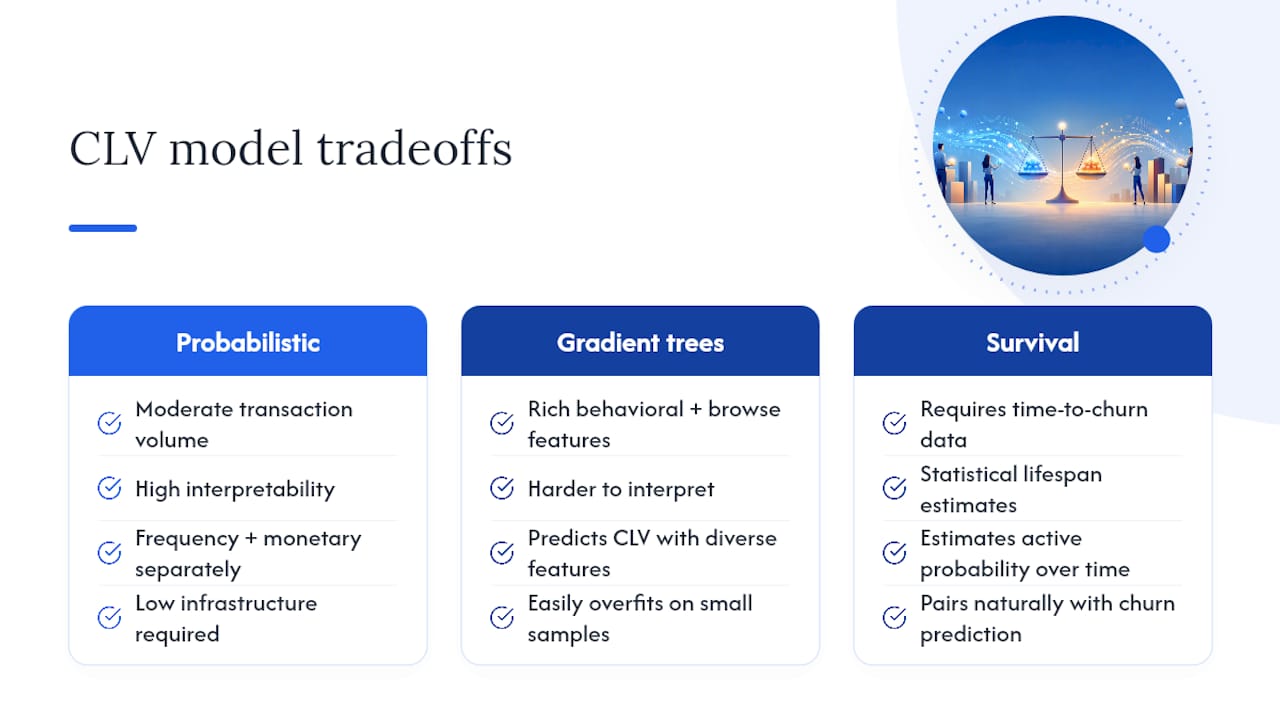
Machine learning approaches to CLV generally fall into a few families, each suited to a different data situation. Probabilistic models like BG/NBD (Beta Geometric/Negative Binomial Distribution) paired with a gamma-gamma model for spend estimate purchase frequency and monetary value separately, then combine them. These work well with moderate transaction volume and don’t require deep learning infrastructure.
Gradient-boosted tree models (frameworks like XGBoost or LightGBM) handle CLV prediction when you have rich behavioral features, browsing data, support tickets, engagement signals, alongside transaction history. They tend to outperform probabilistic models when you have enough labeled data and diverse features, but they’re harder to interpret and easier to overfit.
Survival analysis models estimate the probability a customer remains active at any given point, which pairs naturally with churn prediction and gives you a lifespan estimate grounded in statistical rigor rather than a flat average.
The mistake teams make most often is skipping straight to the most sophisticated technique available instead of matching model complexity to data volume. A gradient-boosted model trained on 2,000 customers will overfit badly and produce recommendations that look precise but aren’t reliable. Validate any predictive model against a holdout period, not just a holdout sample, meaning you train on data through a cutoff date and test whether the model’s predictions actually matched what happened afterward. That single validation step catches more bad models than any amount of feature engineering.
What Are the Biggest Challenges in CLV Analysis?
CLV analysis breaks in predictable ways, and knowing the failure modes in advance saves you from trusting a bad number.
Short data histories are the most common problem. Businesses less than two years old often calculate CLV on customers who haven’t finished half their lifecycle yet, which understates true value and can lead to underinvestment in acquisition.
New product lines and business model changes invalidate historical patterns. If you launched a subscription tier last quarter, your historical CLV model, built on one-time purchase behavior, no longer describes how new customers will actually behave.
Attribution disagreements between platforms distort channel-level CLV specifically. If Meta, Google, and your CRM each claim credit for the same conversion, cohort LTV by channel becomes unreliable exactly where you need it most: deciding where to shift budget.
Outliers skew averages badly in categories with a small number of very high-value customers, like B2B software or luxury goods. A median or trimmed-mean CLV often tells a more honest story than a simple average when your customer base includes a handful of accounts worth 50 times the typical one.
Finally, CLV is inherently a moving target. Customer behavior shifts with pricing changes, competitive pressure, and macroeconomic conditions, so a CLV model calculated once and left untouched for a year is quietly drifting out of date the entire time.
How Do CLV Benchmarks Vary by Industry?
There’s no universal “good” CLV number, because the metric is entirely relative to your margin structure, purchase cycle, and category economics. What counts as strong performance in one industry would signal a struggling business in another.
Subscription and SaaS businesses typically target the highest LTV:CAC ratios, often above 3:1, because their margin structure is favorable and churn is the dominant variable driving CLV up or down. E-commerce businesses selling consumable or repeat-purchase goods (beauty, food, pet supplies) lean on purchase frequency as their primary lever, since individual order values tend to be modest but repeat rates can be high. E-commerce selling durable, infrequent-purchase goods (furniture, appliances, electronics) faces the opposite problem: high AOV but long gaps between purchases, which stretches out the lifespan calculation and makes short-term CLV estimates unreliable.
B2B and enterprise software often show the widest CLV variance across customers, since a single enterprise account can be worth 20 to 100 times a self-serve customer, which is exactly why median or segment-level analysis matters more than a blended average in that category.
The practical takeaway isn’t to chase an industry benchmark you found in a blog post. It’s to establish your own baseline CLV and LTV:CAC ratio, then track whether it’s improving quarter over quarter, since your own trend line tells you more than a cross-industry comparison ever will.
What Tools Handle CLV Analysis Well?
Tooling for CLV analysis splits roughly into three tiers based on how much sophistication you need.
Spreadsheet-based analysis, built in Excel or Google Sheets, works fine for simple and cohort CLV calculations, especially for businesses running historical formulas on a few thousand customers. The limitation isn’t accuracy, it’s scale and maintenance: someone has to keep pulling fresh data and rebuilding the model by hand.
Analytics platforms and CRM systems with built-in CLV or LTV reporting features handle the cohort layer automatically once transaction data is connected, removing the manual rebuild problem but usually stopping short of predictive modeling or cross-channel budget recommendations.
Decision intelligence platforms built specifically for performance marketing, like Getpaidlens, sit a level above both by connecting ad platforms and CRM data directly, validating it for quality issues before it feeds any model, and surfacing ranked, confidence-scored recommendations rather than a raw dashboard the team still has to interpret manually.
The right tier depends on data volume and how often you need to act on the number. If you’re recalculating CLV once a quarter for a board deck, a spreadsheet is fine. If you’re trying to shift daily budget decisions based on cohort performance across five ad platforms, manual tooling becomes the bottleneck long before the math does.
How Does CLV Inform Segmentation and Personalization?
CLV becomes far more useful once it stops being a single company-wide number and starts feeding your segmentation model directly. High-CLV segments deserve different treatment across the entire customer journey, not just a bigger acquisition budget.
On the acquisition side, lookalike audiences built from your top-quartile CLV customers, rather than all past purchasers, tend to attract a higher-value cohort from the start, since the algorithm learns from the customers actually worth acquiring instead of the average one.
On the retention and messaging side, personalization engines can route high-CLV segments toward loyalty perks, early access, or dedicated support, while lower-CLV segments get standard nurture sequences that cost less to run. This isn’t about treating some customers worse. It’s about matching the cost of retention effort to the value each segment is likely to return.
Product and merchandising teams use the same segmentation to decide what to build next. If your highest-CLV segment consistently buys a specific product combination, that’s a signal for bundling and cross-sell design, not just a marketing insight.
The integration point that matters most operationally is consistent naming and tagging across campaigns, so CLV segments stay attributable back to the channel and creative that produced them. Without that consistency, your personalization engine and your CLV analysis end up working from two different definitions of the same customer.
Adopting CLV Analysis Without Overcomplicating It
The teams that get real value from CLV analysis treat every dollar as a question: which segment returns the most long-term value for the next dollar spent, not which channel has historically performed best. That reframing changes budget meetings more than any dashboard does.
Start with simple, revenue-based CLV. Validate your data before trusting cohort numbers, and only reach for predictive modeling once you have the volume and infrastructure to support it. Assign ownership of the recalculation, monthly for fast-moving businesses, quarterly for slower purchase cycles, so the number stays current instead of becoming a stale slide nobody revisits.
CLV analysis is a discipline, not a one-time report. Treat it that way and it earns a permanent seat in your budget process.
— Shraddha
Turning CLV Insights Into Daily Budget Decisions
Knowing your margin-adjusted CLV is one thing. Acting on it every day, across five ad platforms and a CRM that all define “revenue” slightly differently, is the part that actually breaks most teams.
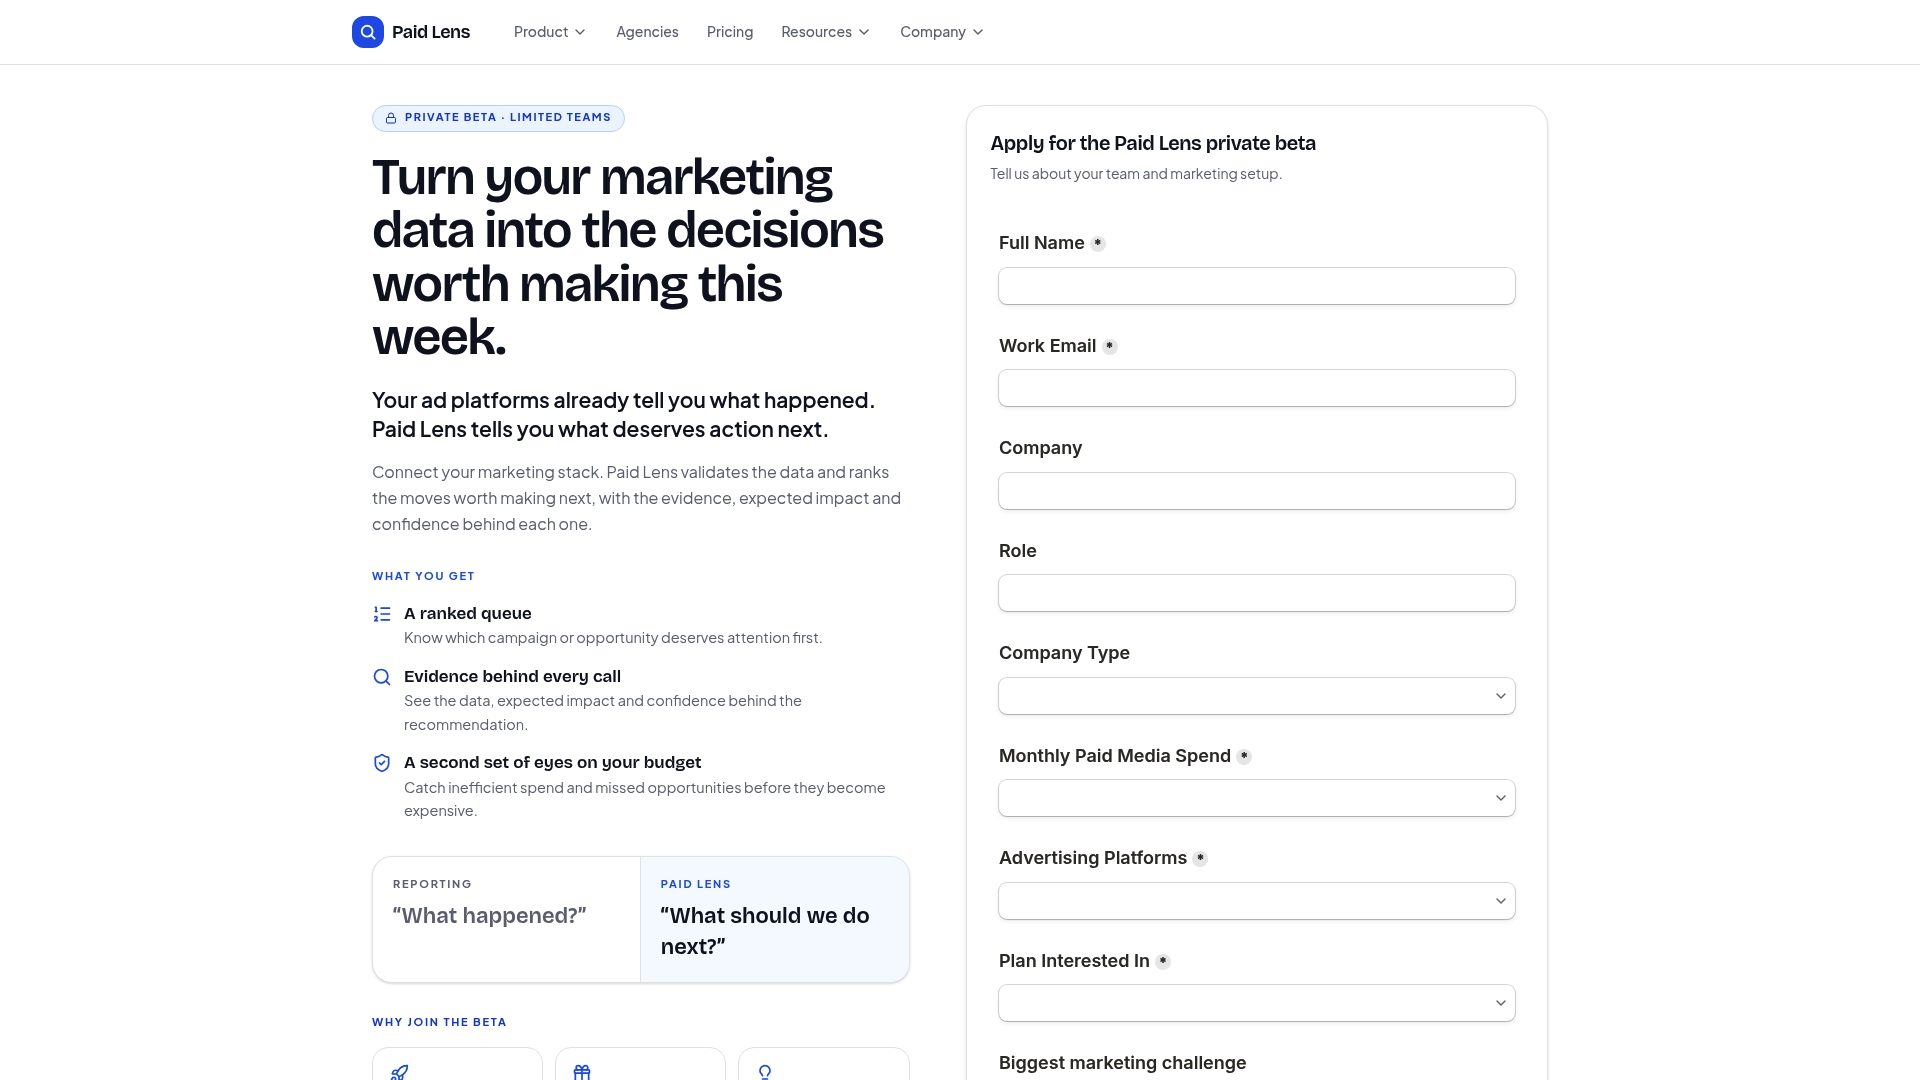
Getpaidlens connects your ad platforms and CRM data, validates it for the exact quality issues that make CLV models unreliable, and turns cohort-level value differences into a ranked queue of recommendations, each with a confidence score attached, so you know which budget shift to make first and why. It’s built for mid-market and enterprise performance marketing teams juggling multiple platforms and client accounts, not solo marketers running a single ad account. If your team is spending hours reconciling spreadsheets before you can even start a CLV conversation, check the available data integrations and see how quickly you could get a validated, single source of truth in place.
Sources
- Customer Lifetime Value Analysis: Formula & Models (2026) - Shopify
- The value of keeping the right customers | HBR
- Customer Lifetime Value Formula | ConversionStudio
FAQ
What Is Customer Lifetime Value Analysis?
It’s the process of estimating the total profit a customer generates over their relationship with your business, then using that figure to set acquisition budgets, prioritize retention spend, and forecast revenue by segment.
How Do You Calculate Customer Lifetime Value?
Multiply average order value by purchase frequency to get customer value per period, then multiply by average customer lifespan; apply your gross margin percentage to convert that into a margin-adjusted figure suitable for setting acquisition ceilings.
What’s the Difference Between CAC and CLV Analysis?
CAC (customer acquisition cost) measures what you spend to win a customer, while CLV measures what that customer is worth over time; comparing the two as an LTV:CAC ratio, with 3:1 as a common benchmark, tells you whether your acquisition spend is sustainable.
Should I Use Revenue CLV or Margin CLV?
Use margin CLV whenever you’re setting an acquisition budget or CAC ceiling, since revenue CLV ignores cost of goods and will overstate how much you can profitably spend per customer.
When Should I Move From Cohort CLV to Predictive CLV?
Move to predictive modeling once you have at least 24 to 36 months of validated, cross-platform transaction data and enough sample size per segment to avoid overfitting; before that, cohort-based CLV is more reliable and far cheaper to maintain.